Kubernetes
Getting Started with VoltSP in Kubernetes
The best way to understand what VoltSP does is to see it in action. The VoltSP quick start implements three pipelines and deploys them to a Kubernetes environment.
These pipelines are aimed to demonstrate:
- Generating random data and printing it to the console
- Streaming data to Kafka (we will use a Redpanda event streaming platform compatible with Kafka)
- Streaming data from Kafka to Volt Active Data
The source code for the quick start is simple, easy to read, and useful both as a demonstration and as a template for building your own pipelines.
But let's get started. The steps for running the sample pipelines are:
Prerequisites
To run these example pipelines, you will need:
- Java SDK 17 (or later)
- Maven
- A Kubernetes cluster (e.g., a local kind/minikube or a managed cloud cluster)
- Helm
kubectlconfigured to talk to your cluster- A Volt Active Data license including "Active(SP)" feature
- Access to VoltSP charts and images
Additionally, the pipelines we will be deploying in this example require two streaming systems to be set up:
- Kafka broker (Redpanda)
- Volt Active Data (VoltDB)
Also ensure you have the latest information about charts from the respective chart repositories by running:
$ helm repo add redpanda https://charts.redpanda.com
$ helm repo add voltdb https://voltdb-kubernetes-charts.storage.googleapis.com
$ helm repo update
Step1: Installing Kafka
You can deploy Kafka broker into your Kubernetes namespace using the Helm chart:
$ helm install redpanda redpanda/redpanda \
    --set external.enabled=false \
    --set tls.enabled=false
This command deploys the Kafka broker on the Kubernetes cluster in the default configuration.
Kafka broker can be accessed by consumers via port 9093 on the following DNS name from within your cluster:
redpanda.default.svc.cluster.local
Now we need to create topic greetings that will be needed later:
$ kubectl run -ti --rm rpk --image=redpandadata/redpanda:latest --restart=Never -- \
    topic create greetings --brokers redpanda:9093
Step 2: Installing VoltDB
Deploy a Volt Active Data cluster with the official VoltDB Helm chart. You will need to have your license.xml
available locally.
$ helm install db voltdb/voltdb                                       \
  --set-file cluster.config.licenseXMLFile=$HOME/license.xml   \
  --set global.voltdbVersion=14.2.0
This creates a multi-node VoltDB cluster running version 14.2.0 of the database. To access the cluster, you should use
the db-voltdb-cluster-client service:
$ kubectl get svc
NAME                               TYPE           CLUSTER-IP      EXTERNAL-IP    PORT(S)                                          AGE
db-voltdb-cluster-client           ClusterIP      10.108.14.107   <none>         21211/TCP,21212/TCP                              3h50m
db-voltdb-cluster-internal         ClusterIP      None            <none>         3021/TCP,7181/TCP,9090/TCP,11235/TCP,11780/TCP   3h50m
db-voltdb-vmc                      ClusterIP      10.108.15.94    <none>         8080/TCP,8443/TCP                                3h50m
We need to initialize the database with the schema required by the examples we intend to run:
CREATE TABLE GREETINGS (message VARCHAR(128) NOT NULL);
PARTITION TABLE GREETINGS ON COLUMN message;
This can be achieved by executing sqlcmd tool on one of the database pods:
$ kubectl exec -it db-voltdb-cluster-0 -- \
        sqlcmd --query="CREATE TABLE GREETINGS (message VARCHAR(128) NOT NULL); PARTITION TABLE GREETINGS ON COLUMN message;"
Step 3: Downloading the Sample Application
The quick start is available through an archetype that Maven downloads automatically from a central repository. First, set default to the directory where you want to install the sample source files, then issue the following shell command:
$ mvn archetype:generate                                 \
    -DarchetypeGroupId=org.voltdb                        \
    -DarchetypeArtifactId=volt-stream-maven-quickstart   \
    -DarchetypeVersion={{ maven.project.version }}
The script will ask you to input the group ID and artifact ID.
These represent the package prefix (such as org.acme) and the name for the sample directory, respectively.
In the following examples we will use org.acme as the package prefix and sample as the sample name.
The script then asks a series of questions where you can take the default answer. For example:
$ mvn archetype:generate \
    -DarchetypeGroupId=org.voltdb \
    -DarchetypeArtifactId=volt-stream-maven-quickstart \
    -DarchetypeVersion={{ maven.project.version }}
[ . . . ]
Define value for property 'groupId': org.acme
Define value for property 'artifactId': sample
Define value for property 'version' 1.0-SNAPSHOT
Define value for property 'package' org.acme
Confirm properties configuration:
kafka-bootstrap-servers: REPLACE-ME-IN-PIPELINE-YAML
voltdb-servers: REPLACE-ME-IN-PIPELINE-YAML
voltsp-api-version: {{ maven.project.version }}
groupId: org.acme
artifactId: sample
version: 1.0-SNAPSHOT
package: org.acme
Y: :
[ . . . ]
[INFO] -----------------------------------------------
[INFO] BUILD SUCCESS
[INFO] -----------------------------------------------
What the script does is create a subdirectory in the current folder named after the artifact ID. Within that directory
there are the Java source files for building the pipeline template and resources needed to run the pipelines. For
example, if you chose sample as your artifact ID and org.acme as the group ID:
sample/— contains a README and the Mavenpom.xmlfile for building the sample pipelinessample/src/main/java/org/acme/— contains the Java source files defining the pipelinessample/src/main/resources— contains assets, including Helm YAML files and SQL schema, needed to run the pipelines
Step 4: Building the Sample Application
Once you download the sample source files, you can build the pipeline templates using Maven.
Set default to the sample directory created in the previous step and issue the mvn clean package command:
$ cd sample
$ mvn clean package
Maven compiles all the source files, runs basic tests, then packages the whole application into a jar file inside
target directory as target/sample-1.0-SNAPSHOT.jar.
Step 5: Running the Sample Pipelines
You are almost ready to run the sample pipelines. The last step before you can run the pipelines is to configure Kafka broker and VoltDB addresses in the pipeline configuration.
Recall how in section Installing Kafka we noted the Kafka broker address is: redpanda.default.svc.cluster.local:9093
and in VoltDB section we noted client service to be db-voltdb-cluster-client. Now you can insert those addresses
into the YAML files kafka-to-volt-pipeline.yaml and random-to-kafka-pipeline.yaml (found in src/main/resources).
For example, kafka-to-volt-pipeline.yaml might look like this:
replicaCount: 1

resources:
    limits:
        cpu: 2
        memory: 2G
    requests:
        cpu: 2
        memory: 2G

streaming:
    pipeline:
        className: org.acme.KafkaToVoltPipeline

        configuration:
            sink:
                voltdb:
                    cluster: "db-voltdb-cluster-client"
            source:
                kafka:
                    topicNames: "greetings"
                    bootstrapServers: "redpanda.default.svc.cluster.local:9093"
                    groupId: "1"
Defining the configuration as YAML properties is the most flexible option. For alternative methods of defining the configuration properties, see the section on Helm Configuration Options.
Once you set up the necessary infrastructure and edit the YAML files, you are ready to start the pipelines. You start the pipelines using Helm and specifying the following items:
- A name for the pipeline
- The VoltSP chart (voltdb/volt-streams)
- Your license
- The application jar file
- The YAML properties file
If you have not defined an environment variable for the license file yet, now is a good time to do that. For example:
$ export MY_VOLT_LICENSE=$HOME/license.xml

$ helm install pipeline1 voltdb/volt-streams                       \
    --set-file streaming.licenseXMLFile=${MY_VOLT_LICENSE}         \
    --set-file streaming.voltapps=target/sample-1.0-SNAPSHOT.jar   \
    --values src/main/resources/random-to-kafka-pipeline.yaml
Note: Note that the name of the jar file depends on the value of
artifactIdandversionthat were provided during archetype execution. It is, however, always placed insidetargetdirectory.
The Helm command starts the Kubernetes pod and starts pushing random hello statements into the Kafka topic. You can then start the second pipeline, which pulls the statements from the topic and inserts them into the GREETINGS table in the database:
$ helm install pipeline2 voltdb/volt-streams                       \
    --set-file streaming.licenseXMLFile=${MY_VOLT_LICENSE}         \
    --set-file streaming.voltapps=target/sample-1.0-SNAPSHOT.jar   \
    --values src/main/resources/kafka-to-volt-pipeline.yaml
Once the pipelines are running, you can see the results by monitoring the greetings topic in Kafka or querying the
GREETINGS table in VoltDB:
$ kubectl exec -it db-voltdb-cluster-0 -- sqlcmd

SQL Command :: localhost:21212
> select count(*) from greetings;
Or, if you want to use a Grafana dashboard to monitor the pipelines, just enable monitoring to have Prometheus start scraping metrics from the pipelines.
$ helm upgrade pipeline1 voltdb/volt-streams   \
    --reuse-values                             \
    --set monitoring.prometheus.enabled=true
(Optional) Installing the Management Console
VoltSP provides a standalone Management Console chart that bundles Prometheus, Grafana, Loki, and Pyroscope for metrics, logs, and profiling:
$ helm install mc voltdb/management-console
The Management Console can also be enabled when the pipeline is deployed be setting management-console.enabled to
true.
$ helm install pipeline1 voltdb/volt-streams       \
        --set management-console.enabled=true      \
Note: The above command will start separate Grafana, Loki and Prometheus pods for this pipeline release, which is probably too resource intensive if more pipelines are deployed. We advise installing a standalone Management Console.
The Management Console chart installs:
Prometheusfor scraping metrics from podsLokifor log processing- Optionally
Pyroscopefor gathering traces Grafanawith pre-made dashboards
To open the Grafana dashboard, you need to get the IP address of the Grafana service:
$ kubectl get svc
NAME                               TYPE           CLUSTER-IP      EXTERNAL-IP     PORT(S)                                          AGE
mc-management-console-grafana      LoadBalancer   10.108.14.252   11.22.33.44     80:32192/TCP                                     84m
mc-management-console-loki         ClusterIP      10.108.14.86    <none>          3100/TCP                                         84m
mc-management-console-prometheus   ClusterIP      10.108.12.9     <none>          9090/TCP                                         84m
...
If the EXTERNAL-IP is assigned navigate to http://11.22.33.44/dashboards.
If not, you might want to port forward Grafana's http port to your local machine (replace <LOCAL_PORT> with a port
that you know is available on your machine):
$ kubectl port-forward service/mc-management-console-grafana <LOCAL_PORT>:80
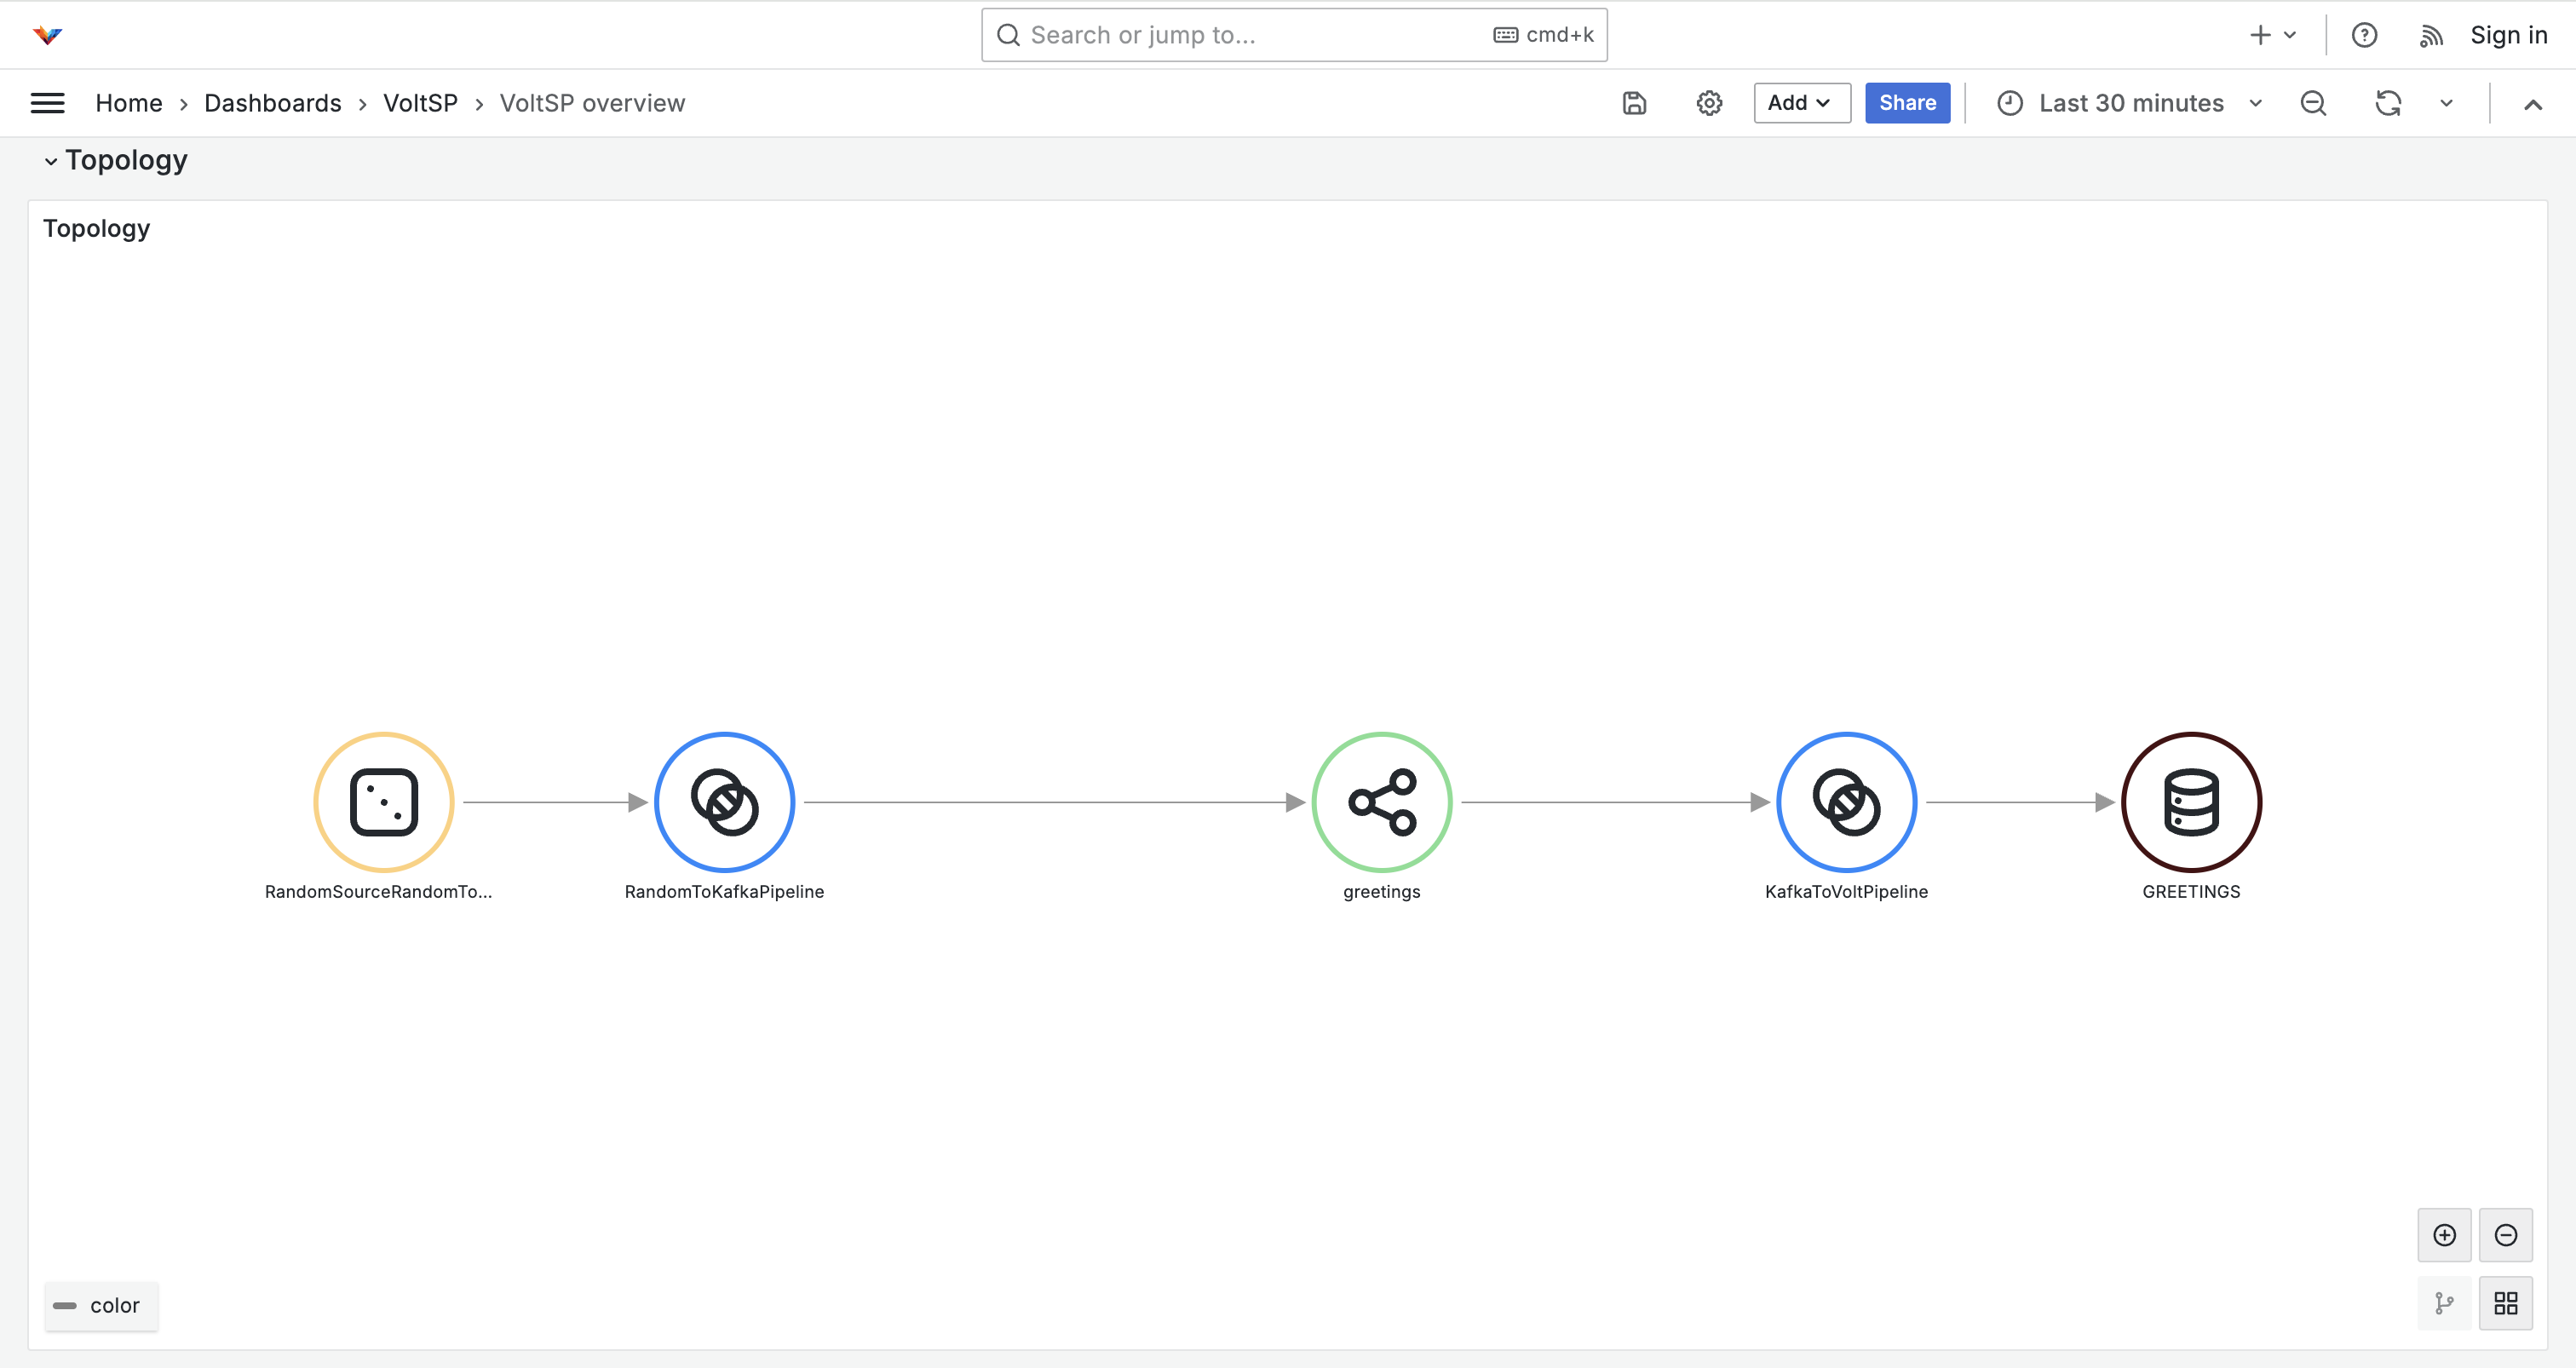
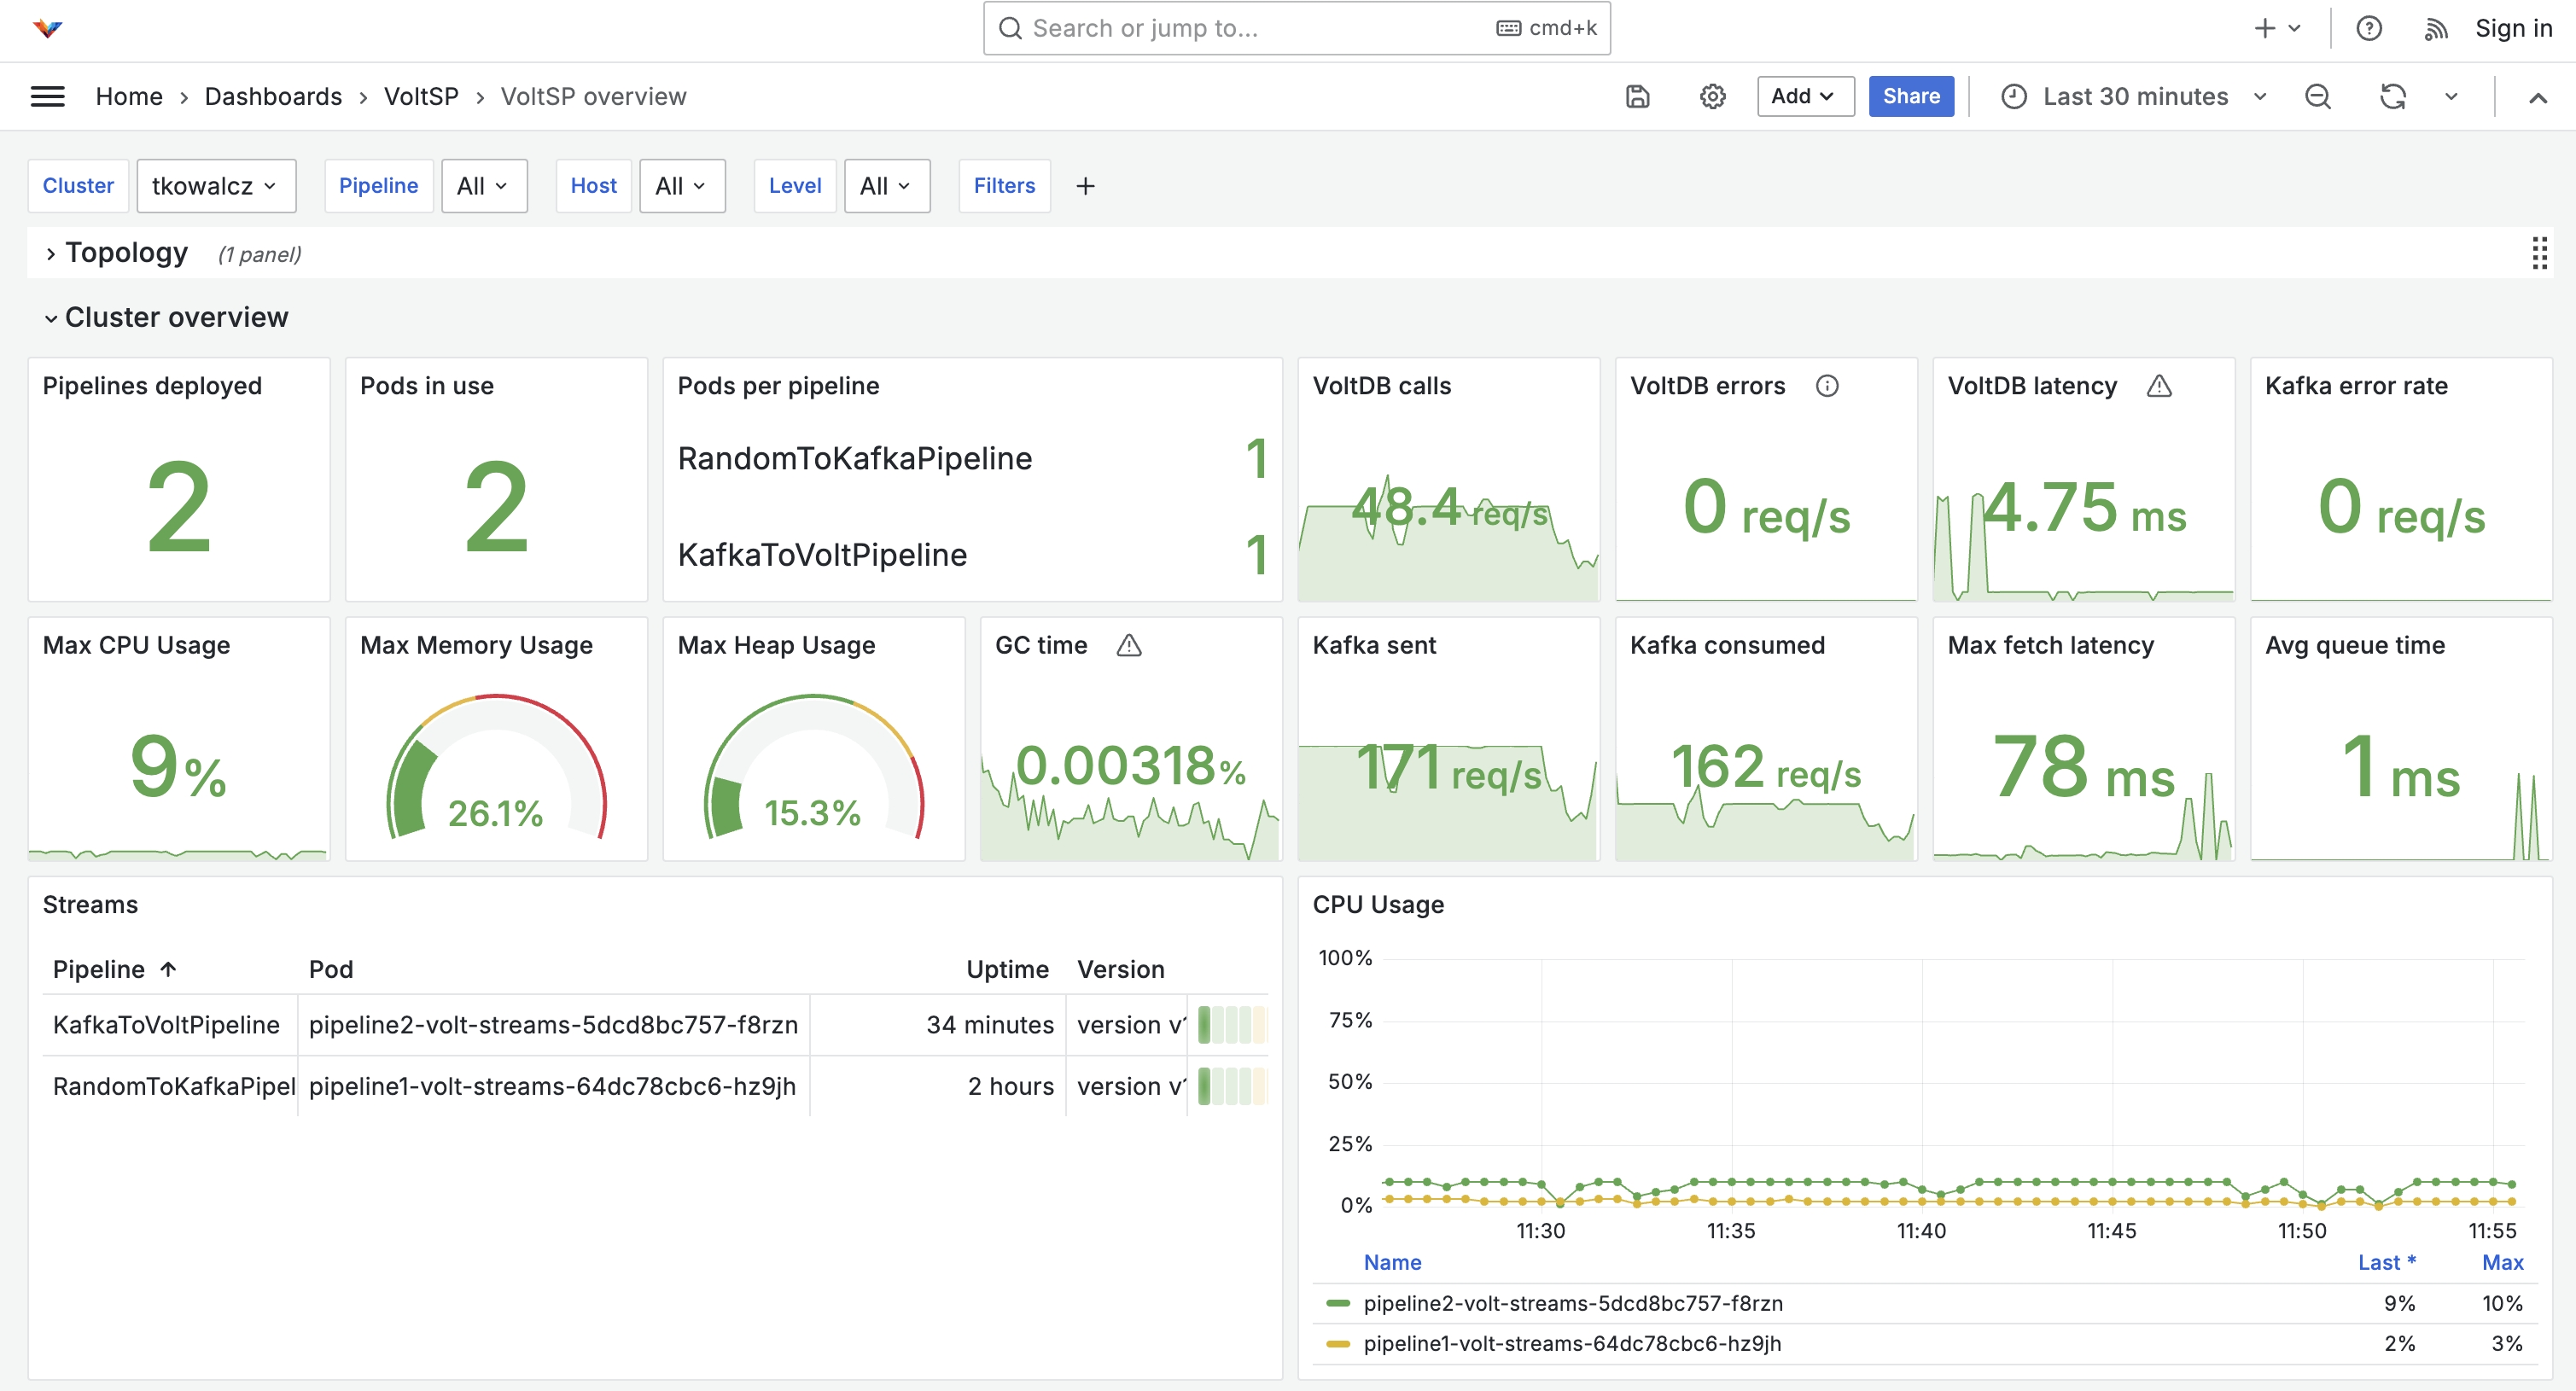
Then go to http://localhost:<LOCAL_PORT>/dashboards.
You should be able to select "VoltSP" dashboard and see an overview of the cluster and topology of all installed pipelines.
Next Steps
- See how to develop pipelines in Java.
- Check the details of configuring pipelines using Helm.