Benchmarking is the process of evaluating performance against a known baseline. For database applications, you can benchmark against other technologies, against a target metric (such as a specific number of transactions per second), or you can use the same application on different hardware configurations to determine which produces the best results.
For VoltDB applications, benchmarking is useful for establishing metrics with regards to:
Optimum throughput
Optimum number of sites per host
When establishing performance criteria for database applications, there are usually two key metrics:
Throughput — how many transactions can be completed at one time, usually measured in transactions per second, or TPS
Latency — how long each individual transaction takes, usually measured as the average or percentile of the latency for a sample number of transactions
Note that neither of these metrics is exact. For many databases, throughput can vary depending upon the type of transaction; whether it is a read or write operation. One of the advantages of VoltDB is that throughput does not change significantly for write versus read operations. However, VoltDB throughput does change when there are many multi-partitioned transactions versus a single-partitioned transaction workload. This is why it is important to design your schema and stored procedures correctly when benchmarking a VoltDB database.
Similarly, latency can vary, both in how it is measured and what impacts it. You can measure latency as the time from when the client issues a transaction request until the response is received, or from when the database server receives the request until it queues the response.
The former measurement, latency from the client application's perspective, is perhaps the most accurate "real world" metric. However, this metric includes both database latency and any network latency between the client and the server. The latter measurement, latency from the database perspective, is a more accurate measurement of the technology's capability. This metric includes the time required to process the transaction itself (that is, the stored procedures and the database queries it contains) as well as time the request spends in the queue waiting to be executed.
There is a relationship between throughput, latency, and system configuration. Throughput is a combination of the amount of time it takes to execute a transaction (which is part of latency) and the number of transactions that can be run in parallel (that is, the percentage of single-partitioned transactions plus the number of unique partitions, which is a combination of sites per host and number of servers).
This is why it is important that benchmarking for performance be done in conjunction with benchmarking for server configuration (as discussed later). Different configurations will result in different values for throughput and latency.
Your benchmark results are also affected by the design of the application itself.
As mentioned before, throughput and latency are not abstract numbers. They are a consequence of the schema, stored procedures, application, and server configuration in use. As with any VoltDB solution, to affectively benchmark performance you must start with a well-designed application. Specifically:
Partition all tables (except those that are small and primarily read-only)
Make all frequent transactions single-partitioned
Use asynchronous procedure calls
See Chapter 2, Proof of Concept for more information on writing effective VoltDB applications.
It is common practice to start benchmarking with the proof of concept, since the POC includes an initial schema and the key transactions required by the solution. If you decide to proceed with development, it is also a good idea to benchmark the application periodically throughout the process to make sure you understand how the additional functions impact your overall performance targets.
However, before benchmarking the POC, it is important to decide how you are going to measure performance. The following sections provide useful information for determining what and how to measure performance in a VoltDB application.
Latency and throughput are related. To measure throughput, your test application can make stored procedure calls as fast as it can and then measure how many are completed in a second (TPS). However, if the test application invokes more transactions that the server can complete in that time frame, the additional invocations must wait in the queue before being processed. The time these transactions wait in the queue will result in the latency measurement suddenly spiking.
There is an optimal throughput for any given application and system configuration. As the rate of invocations from the client application increases, there is a direct increase in TPS while latency stays relatively flat. However, as the invocation rate approaches and surpasses the optimal throughput (the limit of what the current configuration can process), latency increases dramatically and TPS may even drop, as shown in Figure 5.1, “Determining Optimal Throughput and Latency”.
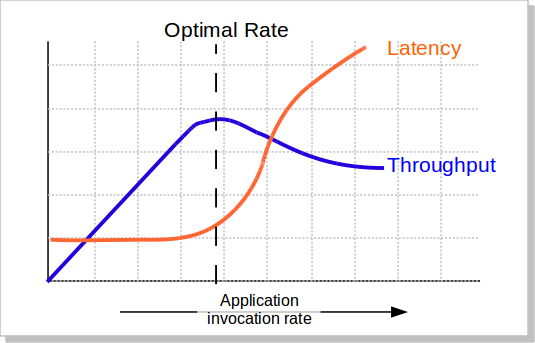
If your test application "fire hoses" the database server — that is, it sends invocations as fast as it can — all you can measure is the misleading throughput and latency on the right side of the preceding chart. To determine the optimal rate, you need to be able control the rate at which your benchmark application submits transaction requests. This process is called rating limiting.
At its simplest, rate limiting is constraining the number of invocations issued by the application. For example,
the following program loop, constrains the application to invoking the SignIn stored procedure a
maximum of 10 times per millisecond, or 10,000 times per second.
boolean done = false;
long maxtxns = 10;
while (!done) {
  long txns = 0;
  long millisecs = System.currentTimeMillis();
  while (millisecs == System.currentTimeMillis()) {
      if ( txns++ < maxtxns } {
         myClient.callProcedure(new SignInCallback(),
                                "SignIn",
                                id, millisecs);
      }
  }
}
You could use a command line argument to parameterize the rate limit value maxtxns and then use
multiple runs of the application to create a graph similar to Figure 5.1, “Determining Optimal Throughput and Latency”. An even better
approach is to use a limit on latency to automatically control the invocation rate and let the application close in on
the optimal throughput value.
How rate limiting based on latency is done is to have a variable for the target latency as well as a variable for
maximum allowable throughput (such as maxtxns in the preceding example). The application measures
both the average throughput and latency for a set period (every 1 to 5 seconds, for example). If the average latency
exceeds the goal, reduce the maximum transactions per second, then repeat. After the same period, if the latency still
exceeds the goal, reduce the maximum transaction rate again. If the latency does meet the goal,
incrementally increase the maximum transaction rate.
By using this mix of rate limiting and automated adjustment based on a latency goal, the test application will eventually settle on an optimal throughput rate for the current configuration. This is the method used by the sample applications (such as voter and Voltkv) that are provided with the VoltDB software.
Normally for benchmarking it is necessary to "instrument" the application. That is, add code to measure and report on the benchmark data. Although it is possible (and easy) to instrument a VoltDB application, it is not necessary.
The easiest way to measure throughput for a VoltDB database is to monitor the database while the benchmark application is running. You can monitor a database using the VoltDB Management Console, which is available from any VoltDB server and provides a graphical display of the overall throughput for the database cluster.
For more detailed information, you can instrument your application by using a variable to track the number of completed transactions (incrementing the variable in the asynchronous procedure callback). You then periodically report the average TPS by dividing the number of transactions by the number of seconds since the last report. This approach lets you configure the reporting to whatever increment you choose.
See the voter sample application for an example of an instrumented benchmarking application. The README for the voter application explains how to customize the reporting through the use of command line arguments.
It is also possible to get a sense of the overall latency without instrumenting your application using the VoltDB Management Console. The latency graph provided by the Management Console shows the average latency, measured every few seconds, as reported by the server. At times, this method can produce a dramatic sawtooth graph with extreme highs and lows. In this case, the best way to interpret the overall latency of the application is to imagine a line drawn across the high points of the graph.
For a more accurate benchmark, you can use latency metrics built into the VoltDB system procedures and Java client interface. To instrument your client application, you can use the ClientResponse interface returned by stored procedures invocations to measure latency. Part of the ClientResponse class are the getClientRoundTrip() and getClusterRoundTrip() methods. Both methods return an integer value representing the number of milliseconds required to process the transaction. The getClientRoundTrip() method reports total latency, including the network round trip from the client application to the server. The getClusterRoundTrip() method reports an estimate of the latency associated with the database only.
It is easy to use these methods to collect and report custom latency information. For example, the following code fragment captures information about the minimum, maximum, and combined latency during each procedure callback.
static class PocCallback implements ProcedureCallback {
   @Override
   public void clientCallback(ClientResponse response) {

      txncount++;
      int latency = response.getClusterRoundTrip();
      if (latency < minlatency) minlatency = latency;
      if (latency > maxlatency) maxlatency = latency;
      sumlatency += latency;
              .
              .
              .
The benchmarking application can then use this information to periodically report specific latency values, like so:
if (System.currentTimeMillis() >= nextreport ) {
      // report latency
  printf("Min latency: %d\n" +
         "Max latency: %d\n" +
         "Average latency: %d\n",
          minlatency, maxlatency, sumlatency/txncount);
      // reset variables
  txncount=0;
  minlatency = 5000;
  maxlatency = 0;
  sumlatency = 0;
      // report every 5 secsonds
  nextreport = System.currentTimeMillis() + 5000;
}